DataDog
LiteLLM Supports logging to the following Datdog Integrations:
datadogDatadog Logsdatadog_llm_observabilityDatadog LLM Observabilityddtrace-runDatadog Tracing
Datadog Logs
| Feature | Details |
|---|---|
| What is logged | StandardLoggingPayload |
| Events | Success + Failure |
| Product Link | Datadog Logs |
We will use the --config to set litellm.callbacks = ["datadog"] this will log all successful LLM calls to DataDog
Step 1: Create a config.yaml file and set litellm_settings: success_callback
model_list:
 - model_name: gpt-3.5-turbo
    litellm_params:
      model: gpt-3.5-turbo
litellm_settings:
  callbacks: ["datadog"] # logs llm success + failure logs on datadog
  service_callback: ["datadog"] # logs redis, postgres failures on datadog
Datadog LLM Observability
Overview
| Feature | Details |
|---|---|
| What is logged | StandardLoggingPayload |
| Events | Success + Failure |
| Product Link | Datadog LLM Observability |
model_list:
 - model_name: gpt-3.5-turbo
    litellm_params:
      model: gpt-3.5-turbo
litellm_settings:
  callbacks: ["datadog_llm_observability"] # logs llm success logs on datadog
Step 2: Set Required env variables for datadog
Direct API
Send logs directly to Datadog API:
DD_API_KEY="5f2d0f310***********" # your datadog API Key
DD_SITE="us5.datadoghq.com"       # your datadog base url
DD_SOURCE="litellm_dev"       # [OPTIONAL] your datadog source. use to differentiate dev vs. prod deployments
Via DataDog Agent
Send logs through a local DataDog agent (useful for containerized environments):
DD_AGENT_HOST="localhost"         # hostname or IP of DataDog agent
DD_AGENT_PORT="10518"             # [OPTIONAL] port of DataDog agent (default: 10518)
DD_API_KEY="5f2d0f310***********" # [OPTIONAL] your datadog API Key (agent handles auth)
DD_SOURCE="litellm_dev"           # [OPTIONAL] your datadog source
When DD_AGENT_HOST is set, logs are sent to the agent instead of directly to DataDog API. This is useful for:
- Centralized log shipping in containerized environments
- Reducing direct API calls from multiple services
- Leveraging agent-side processing and filtering
Step 3: Start the proxy, make a test request
Start proxy
litellm --config config.yaml --debug
Test Request
curl --location 'http://0.0.0.0:4000/chat/completions' \
    --header 'Content-Type: application/json' \
    --data '{
    "model": "gpt-3.5-turbo",
    "messages": [
        {
        "role": "user",
        "content": "what llm are you"
        }
    ],
    "metadata": {
        "your-custom-metadata": "custom-field",
    }
}'
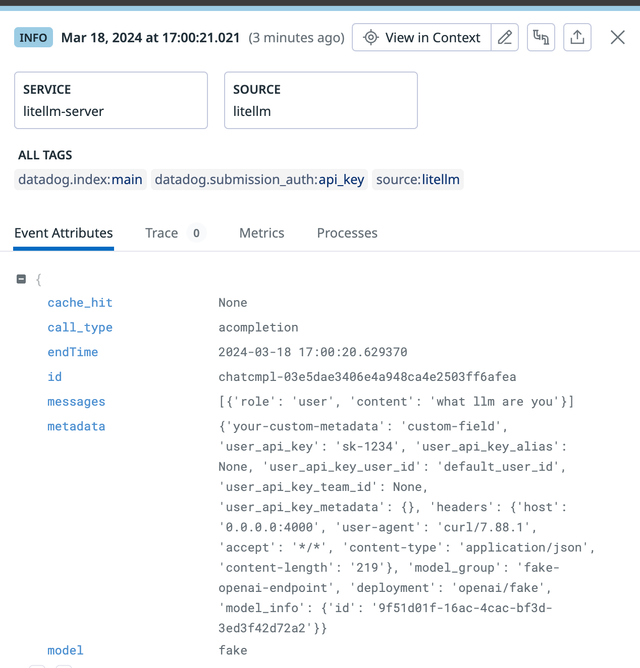
Expected output on Datadog
Redacting Messages and Responses
This section covers how to redact sensitive data from messages and responses in the logged payload on Datadog LLM Observability.
When redaction is enabled, the actual message content and response text will be excluded from Datadog logs while preserving metadata like token counts, latency, and model information.
Step 1: Configure redaction in your config.yaml
model_list:
 - model_name: gpt-3.5-turbo
    litellm_params:
      model: gpt-3.5-turbo
litellm_settings:
  callbacks: ["datadog_llm_observability"] # logs llm success logs on datadog

  # Params to apply only for "datadog_llm_observability" callback
  datadog_llm_observability_params:
    turn_off_message_logging: true # redacts input messages and output responses
Step 2: Send a chat completion request
curl --location 'http://0.0.0.0:4000/chat/completions' \
    --header 'Content-Type: application/json' \
    --data '{
    "model": "gpt-3.5-turbo",
    "messages": [
        {
        "role": "user",
        "content": "what llm are you"
        }
    ]
}'
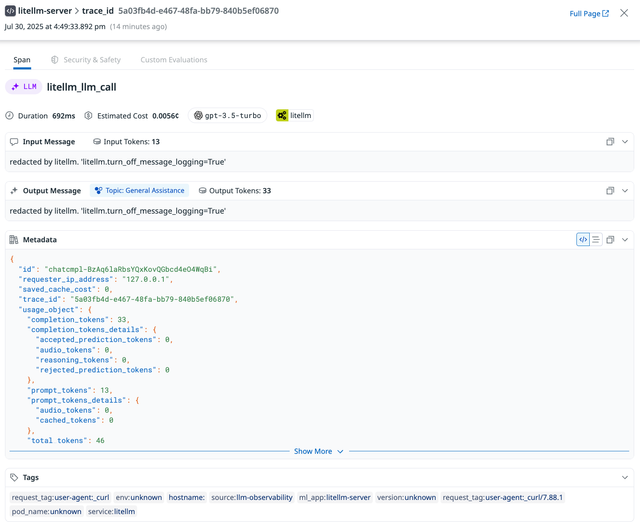
Step 3: Verify redaction in Datadog LLM Observability
On the Datadog LLM Observability page, you should see that both input messages and output responses are redacted, while metadata (token counts, timing, model info) remains visible.
Datadog Tracing
Use ddtrace-run to enable Datadog Tracing on litellm proxy
DD Tracer
Pass USE_DDTRACE=true to the docker run command. When USE_DDTRACE=true, the proxy will run ddtrace-run litellm as the ENTRYPOINT instead of just litellm
DD Profiler
Pass USE_DDPROFILER=true to the docker run command. When USE_DDPROFILER=true, the proxy will activate the Datadog Profiler. This is useful for debugging CPU% and memory usage.
We don't recommend using USE_DDPROFILER in production. It is only recommended for debugging CPU% and memory usage.
docker run \
    -v $(pwd)/litellm_config.yaml:/app/config.yaml \
    -e USE_DDTRACE=true \
    -e USE_DDPROFILER=true \
    -p 4000:4000 \
    ghcr.io/berriai/litellm:main-latest \
    --config /app/config.yaml --detailed_debug
Set DD variables (DD_SERVICE etc)
LiteLLM supports customizing the following Datadog environment variables
| Environment Variable | Description | Default Value | Required |
|---|---|---|---|
DD_API_KEY | Your Datadog API key for authentication (required for direct API, optional for agent) | None | Conditional* |
DD_SITE | Your Datadog site (e.g., "us5.datadoghq.com") (required for direct API) | None | Conditional* |
DD_AGENT_HOST | Hostname or IP of DataDog agent (e.g., "localhost"). When set, logs are sent to agent instead of direct API | None | ❌ No |
DD_AGENT_PORT | Port of DataDog agent for log intake | "10518" | ❌ No |
DD_ENV | Environment tag for your logs (e.g., "production", "staging") | "unknown" | ❌ No |
DD_SERVICE | Service name for your logs | "litellm-server" | ❌ No |
DD_SOURCE | Source name for your logs | "litellm" | ❌ No |
DD_VERSION | Version tag for your logs | "unknown" | ❌ No |
HOSTNAME | Hostname tag for your logs | "" | ❌ No |
POD_NAME | Pod name tag (useful for Kubernetes deployments) | "unknown" | ❌ No |
* Required when using Direct API (default): DD_API_KEY and DD_SITE are required
* Optional when using DataDog Agent: Set DD_AGENT_HOST to use agent mode; DD_API_KEY and DD_SITE are not required